
They say knowledge is power, but knowledge is nothing without data - and that's especially true when it comes to your soil moisture analytics (SMA).
Your moisture analytics graphs are more than just a pretty picture; they're the knowledge you can apply to make powerful farm irrigation decisions that will ultimately impact your bottom line. Too often we see farms or crops with one of two scenarios:
- No tools in place to measure soil moisture levels
- Tools in place but little or no action on the insights from the data returned
On a farm, there’s always a long list of jobs and never enough hours, which can make taking the time to view and action your soil moisture analytics on a daily basis a challenge. For farmers proactive enough to have made the relatively low-cost investment into soil probes and soil moisture analytics, those 10 minutes a day will bring you a return on investment that will far outweigh the time spent stopping to monitor your results: lusher crops, better-nourished cows, richer milk production and of course, much happier FEP auditors.
When you have soil moisture probes you’ve got eyes in the ground, showing how far water applications have penetrated and the actual moisture levels at 100mm intervals. Both overwatering and underwatering can be seen, and the real value is the trend of where your moisture levels are heading. The information is updated and graphed at 15-minute intervals.
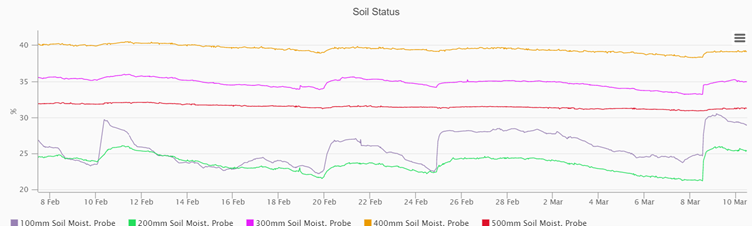
This soil probe information is then displayed again in Soil Moisture Analytics. The root zone is identified by averaging the readings for that zone. This is then displayed as a single line with settings for too wet, too dry, and a sensible operating zone defined. Ideally, it's best to keep this line as flat as possible with the top of the green zone being the best spot to be in. Settings can be altered to fit the season or crop grown.
Under that line SMA we can display rainfall and irrigation amounts and the day they were applied. The effect from these is clearly seen on the soil moisture line.
This data presentation gives you clear information that you need to confidently take action on your farm.
- You can learn from previous applications more about your soil’s response
- There are clearly different responses at different starting moisture points. It’s a lot harder to lift moisture from a low starting point and often irrigation will simply just hold what is already there
- The same amount of rain often gives much higher responses than the same amount of irrigation
- Hot dry weather and high evapotranspiration have a much worse effect if they come when you have a low starting point
When the wrong, or worse, no decisions are made, pasture quality, water quantities and water efficiency are negatively affected. The below graphs help us to understand the common and costly mistakes caused by complacency. Here's how to avoid these errors to ensure your crops and pasture remain at the optimal moisture levels to thrive.
Four common soil moisture ‘she’ll be rights’ that are just wrong
1: “I’m sweet – I’m in the good ol' green zone”
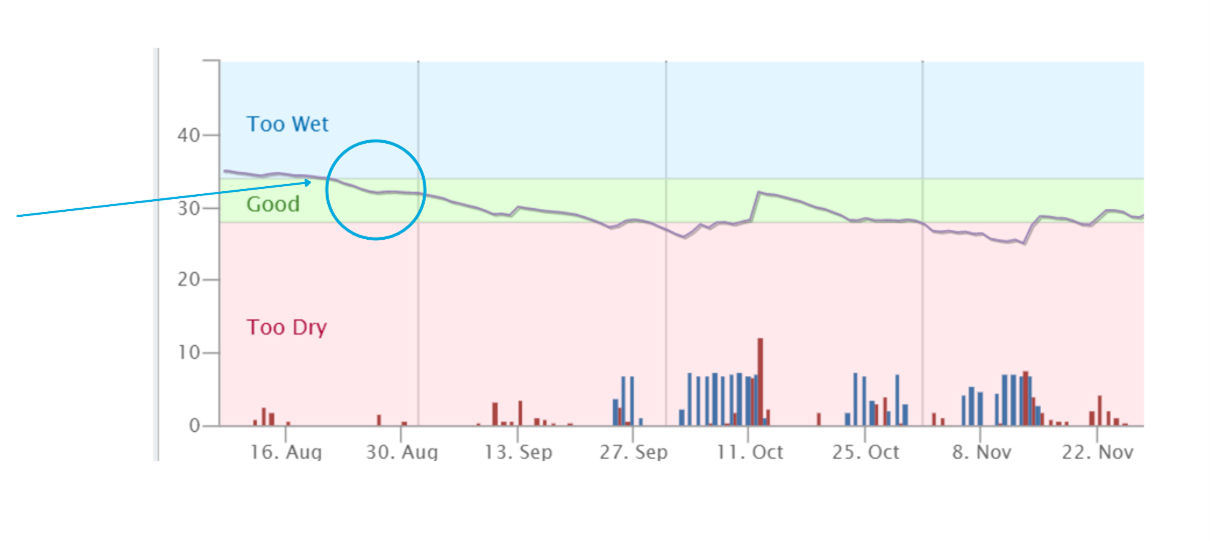
While it’s true that the green zone shown here is a good place to be, you really want to make sure you’re at the top end of the zone. This defines that sweet spot where plants grow well, it’s not muddy and it’s not dry. You can never rest on your laurels here. One nor’wester, two days of hot weather and your good zone can trend up or down, evapotranspiration kicks in and before you know it, you're in the not-so-she’ll-be-right-zone water.
In the following example the moisture levels were good coming out of winter and were OK at the end of August. The irrigation wasn’t turned on until 27 September but being a low moisture starting point all 13 days of irrigation did was hold the moisture at the low level. There would have been a better response had irrigation started 10 days earlier.
2: “I’m sweet – it’s raining”
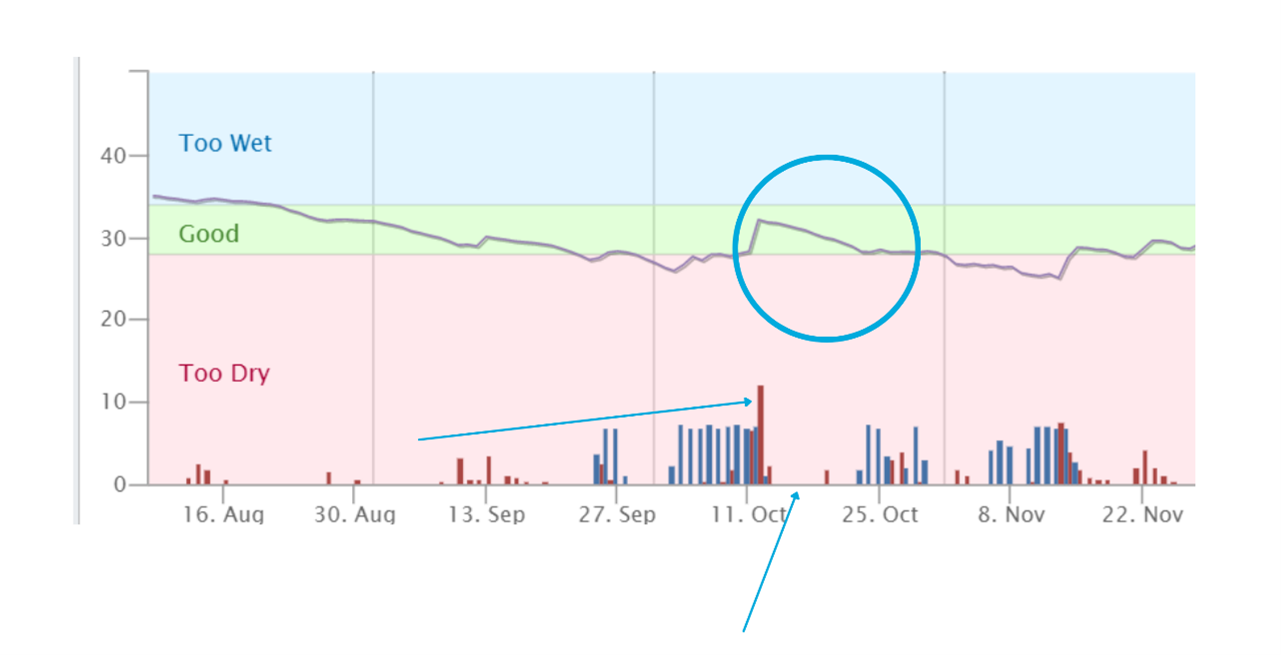
Obviously, rain often gives a much greater moisture response than equivalent irrigation. In the chart below we see rain in the maroon lines and irrigation in the blue. Where circled, this farm was trending into the dry zone. Irrigation helped to lift the line slightly then a spike of rain arrived. This lifted the line dramatically. The irrigators were turned off until 25 October and the consequences over the following days are seen in the trend back down to the dry zone where you can’t irrigate up from easily. It would have been better to irrigate soon after the rain and hold the moisture up toward the top of the green zone.
3: “I’m sweet – I don’t need all that expensive gear, I’ve got gut instinct”
We’ve got some incredible farmers and horticulturists here in New Zealand, but even the best and most experienced farmers can’t know the relationship between weather, temperature, rain, evapotranspiration, wind speed, humidity, solar radiation and windfall on each of their soil types.
That’s why technology is changing the face of farming and making it clear that faster, more accurate decision making is a must for sustainability and profitability. SMA simply gathers rainfall data, irrigation application data and shows how they effect the moisture levels in the soil and what you have to do to get the best out of your pasture and crops.
And it’s more affordable than you think. Soil probes, rain gauges, and meters, are relatively inexpensive. Often farmers already have one or the other but can’t combine them as SMA does. We can use other providers’ information. Water savings, better pasture quality, and better milk production are just a few examples where minimal investment can see maximum return when soil moisture levels are matched to the requirements.
If you really want to harness the leading technology, consider stepping up to our Swan System Predictive Irrigation which brings in full weather prediction, agronomy requirements, fertiliser management, satellite views of cover and moisture and automatically calculates your irrigation timing and amounts.
4: “I’m sweet – I’ll pass my FEP audit no worries”
To pass your FEP audit you need to prove you’ve been a responsible and sustainable irrigator. Passing this by the seat of your pants is a thing of the past. Good soil moisture analytics captured on your farm’s use of water, nutrient and effluent resources and of course, proactive behaviour based on this data, will ensure you have the best shot at obtaining a high farm environmental plan audit rating.
Responsible citizens want to see New Zealand’s rich natural resources thrive and continue to do so into the future. Using quality technology, with accurate data creates a meaningful record of activities with actionable insights into water management. Water is a major part of our daily life on any farm and is key to helping us see our crops and our land thrive.
Watermetrics is passionate and active with water management, which is why we get together with you and making a plan so you to get the best for your business with soil moisture analytics.
Contact us if you’d like to learn more.
Share this
Watermetrics VS Other Soil Moisture Measuring Devices

Improving irrigation practices with soil moisture sensors
